关键词:贸易,贸易量
提供者姓名:曾安、吴宗柠
提供者邮箱:anzeng@bnu.edu.cn
提供者单位:北京师范大学系统科学学院
数据简介:全球商品贸易统计数据,包括6个字段:国家(地区)、贸易量、年份、贸易方向、统计口径、产品类别。
数据来源:联合国商品贸易统计数据库 (UN Comtrade)
数据年份:2000-2019
数据格式:excel
数据大小:140M
读取软件:Microsoft Office,Matlab
使用说明:院内公开,如在院外使用请联系数据提供者
是否提供小样本sample:不提供
下载链接:查看
X
数据使用声明
为尊重知识产权、保障数据作者和数据服务提供者的权益,请数据使用者认真阅读数据提供方的使用规范:https://sssdata.bnu.edu.cn/tabid/40/Default.aspx。在基于本数据所产生的研究成果(包括项目评估报告、验收报告,以及学术论文或毕业论文等)中标注数据来源,并按照[文献引用方式]标注需引用的参考文献,同时将可公开成果提交到"北京师范大学系统科学学院大数据中心邮箱:sssdata.bnu.edu.cn"。
数据来源引用参考以下规范:
中文表达方式:数据来源于联合国商品贸易统计数据库 (UN Comtrade),由北京师范大学系统科学学院整理提供 (http://sss.bnu.edu.cn);英文表达方式:The data comes from the United Nations commodity trade statistics database (UN COMTRADE), which is compiled and provided by the school of systems science of Beijing Normal University( http://sss.bnu.edu.cn )。
致谢方式参考以下规范:
中文致谢方式:"感谢北京师范大学系统科学学院 (https://sssdata.bnu.edu.cn)提供数据支撑。"
英文致谢方式:" Acknowledgement for the data support from School of Systems Science, Beijing Normal University (https://sssdata.bnu.edu.cn)."
*本数据的使用者必须遵守数据提供方的使用要求和使用规范,依照《中华人民共和国数据安全法》的要求存储和使用相关数据。
*未经数据提供者的书面许可,任何单位及个人不得以任何方式或理由对上述数据产品、服务、信息、材料的任何部分进行复制、修改、抄录、传播及销售。
*凡侵犯本平台版权等知识产权的,本平台必依法追究其法律责任,特此郑重声明!
是否同意上述要求?
X
ftp://210.31.77.10
本数据集需要数据提供方认可方能下载(请联系曾安老师anzeng@bnu.edu.cn)。
请下载此表格,由数据提供方曾安老师签字同意后,交到本中心(科技楼B区525,京师科技大厦A座1层208,58807197,sssdata@bnu.edu.cn),方可获得下载账号和密码:
数据资源申请表
相关研究成果:
1. Are We in a De-Globalization Process? The Evidence from Global Trade During 2007–2017
Through the analysis of statistical data, some scholars believe that the globalization of trade is declining, and de-globalization has become a trend, even since the financial crisis in 2008. However, the superficial decline of global trade volume cannot be taken as a corollary of the de-globalization. It needs go deep into the structural analysis, and “globalization or de-globalization” should be discussed by analyzing whether the global trade structure has changed. This paper finds that during 2007–2017, the global trade resistances are clearly classified, and trade resistance in the global community has increased significantly. Second, an expectation maximization (EM) algorithm is applied to divide global trade relations into two categories: intimate trade relations, whose barriers are mainly related to geographical distance; and unfriendly trade relations with high artificial barriers. Third, the trade purity indicator (TPI) is introduced to describe the trade environment of countries, and its evolution indicates after the financial crisis and for quite a long time, the structure of global trade has not changed much. And it shows some deterioration trend and structural adjustment after 2015, which indicates an opportunity for the emergence of de-globalization in such an international environment full of uncertainty and challenges.
原文链接:https://onlinelibrary.wiley.com/doi/10.1002/gch2.202000096

Figure 1. Relationship of trade resistance and geographic distance between countries/regions in 2017. In category I, ln (1/r i, j ) decreases as the logarithm of geographic distance increases in an approximate linear fashion, as ln (1/r i, j ) = −24.48 − 1.55ln d i, j . But there is no correlation between resistance and geographic distance in category II. Due to the size and shape of the earth, the maximum distance between two countries is about 20 000 (≈e 10 ) km.

Figure 6. Change of trade purity indicator I from 2007 to 2017. The countries/regions below the diagonal line (slope=1) have a reduction in TPI.
2、A Topological Analysis of Trade Distance: Evidence from the Gravity Model and Complex Flow Networks
As a classical trade model, the gravity model plays an important role in the trade policy-making process. However, the effect of physical distance fails to capture the effects of globalization and even ignores the multilateral resistance of trade. Here, we propose a general model describing the effective distance of trade according to multilateral trade paths information and the structure of the trade flow network. Quantifying effective trade distance aims to identify the hidden resistance information from trade networks data, and then describe trade barriers. The results show that flow distance, hybrid by multi-path constraint, and international trade network contribute to the forecasting of trade flows. Meanwhile, we also analyze the role of flow distance in international trade from two perspectives of network science and econometric model. At the econometric model level, flow distance can collapse to the predicting results of geographic distance in the proper time lagging variable, which can also reflect that flow distance contains geographical factors. At the international trade network level, community structure detection by flow distances and flow space embedding instructed that the formation of international trade networks is the tradeoff of international specialization in the trade value chain and geographical aggregation. The methodology and results can be generalized to the study of all kinds of product trade systems.
原文链接:https://www.mdpi.com/2071-1050/12/9/3511/htm
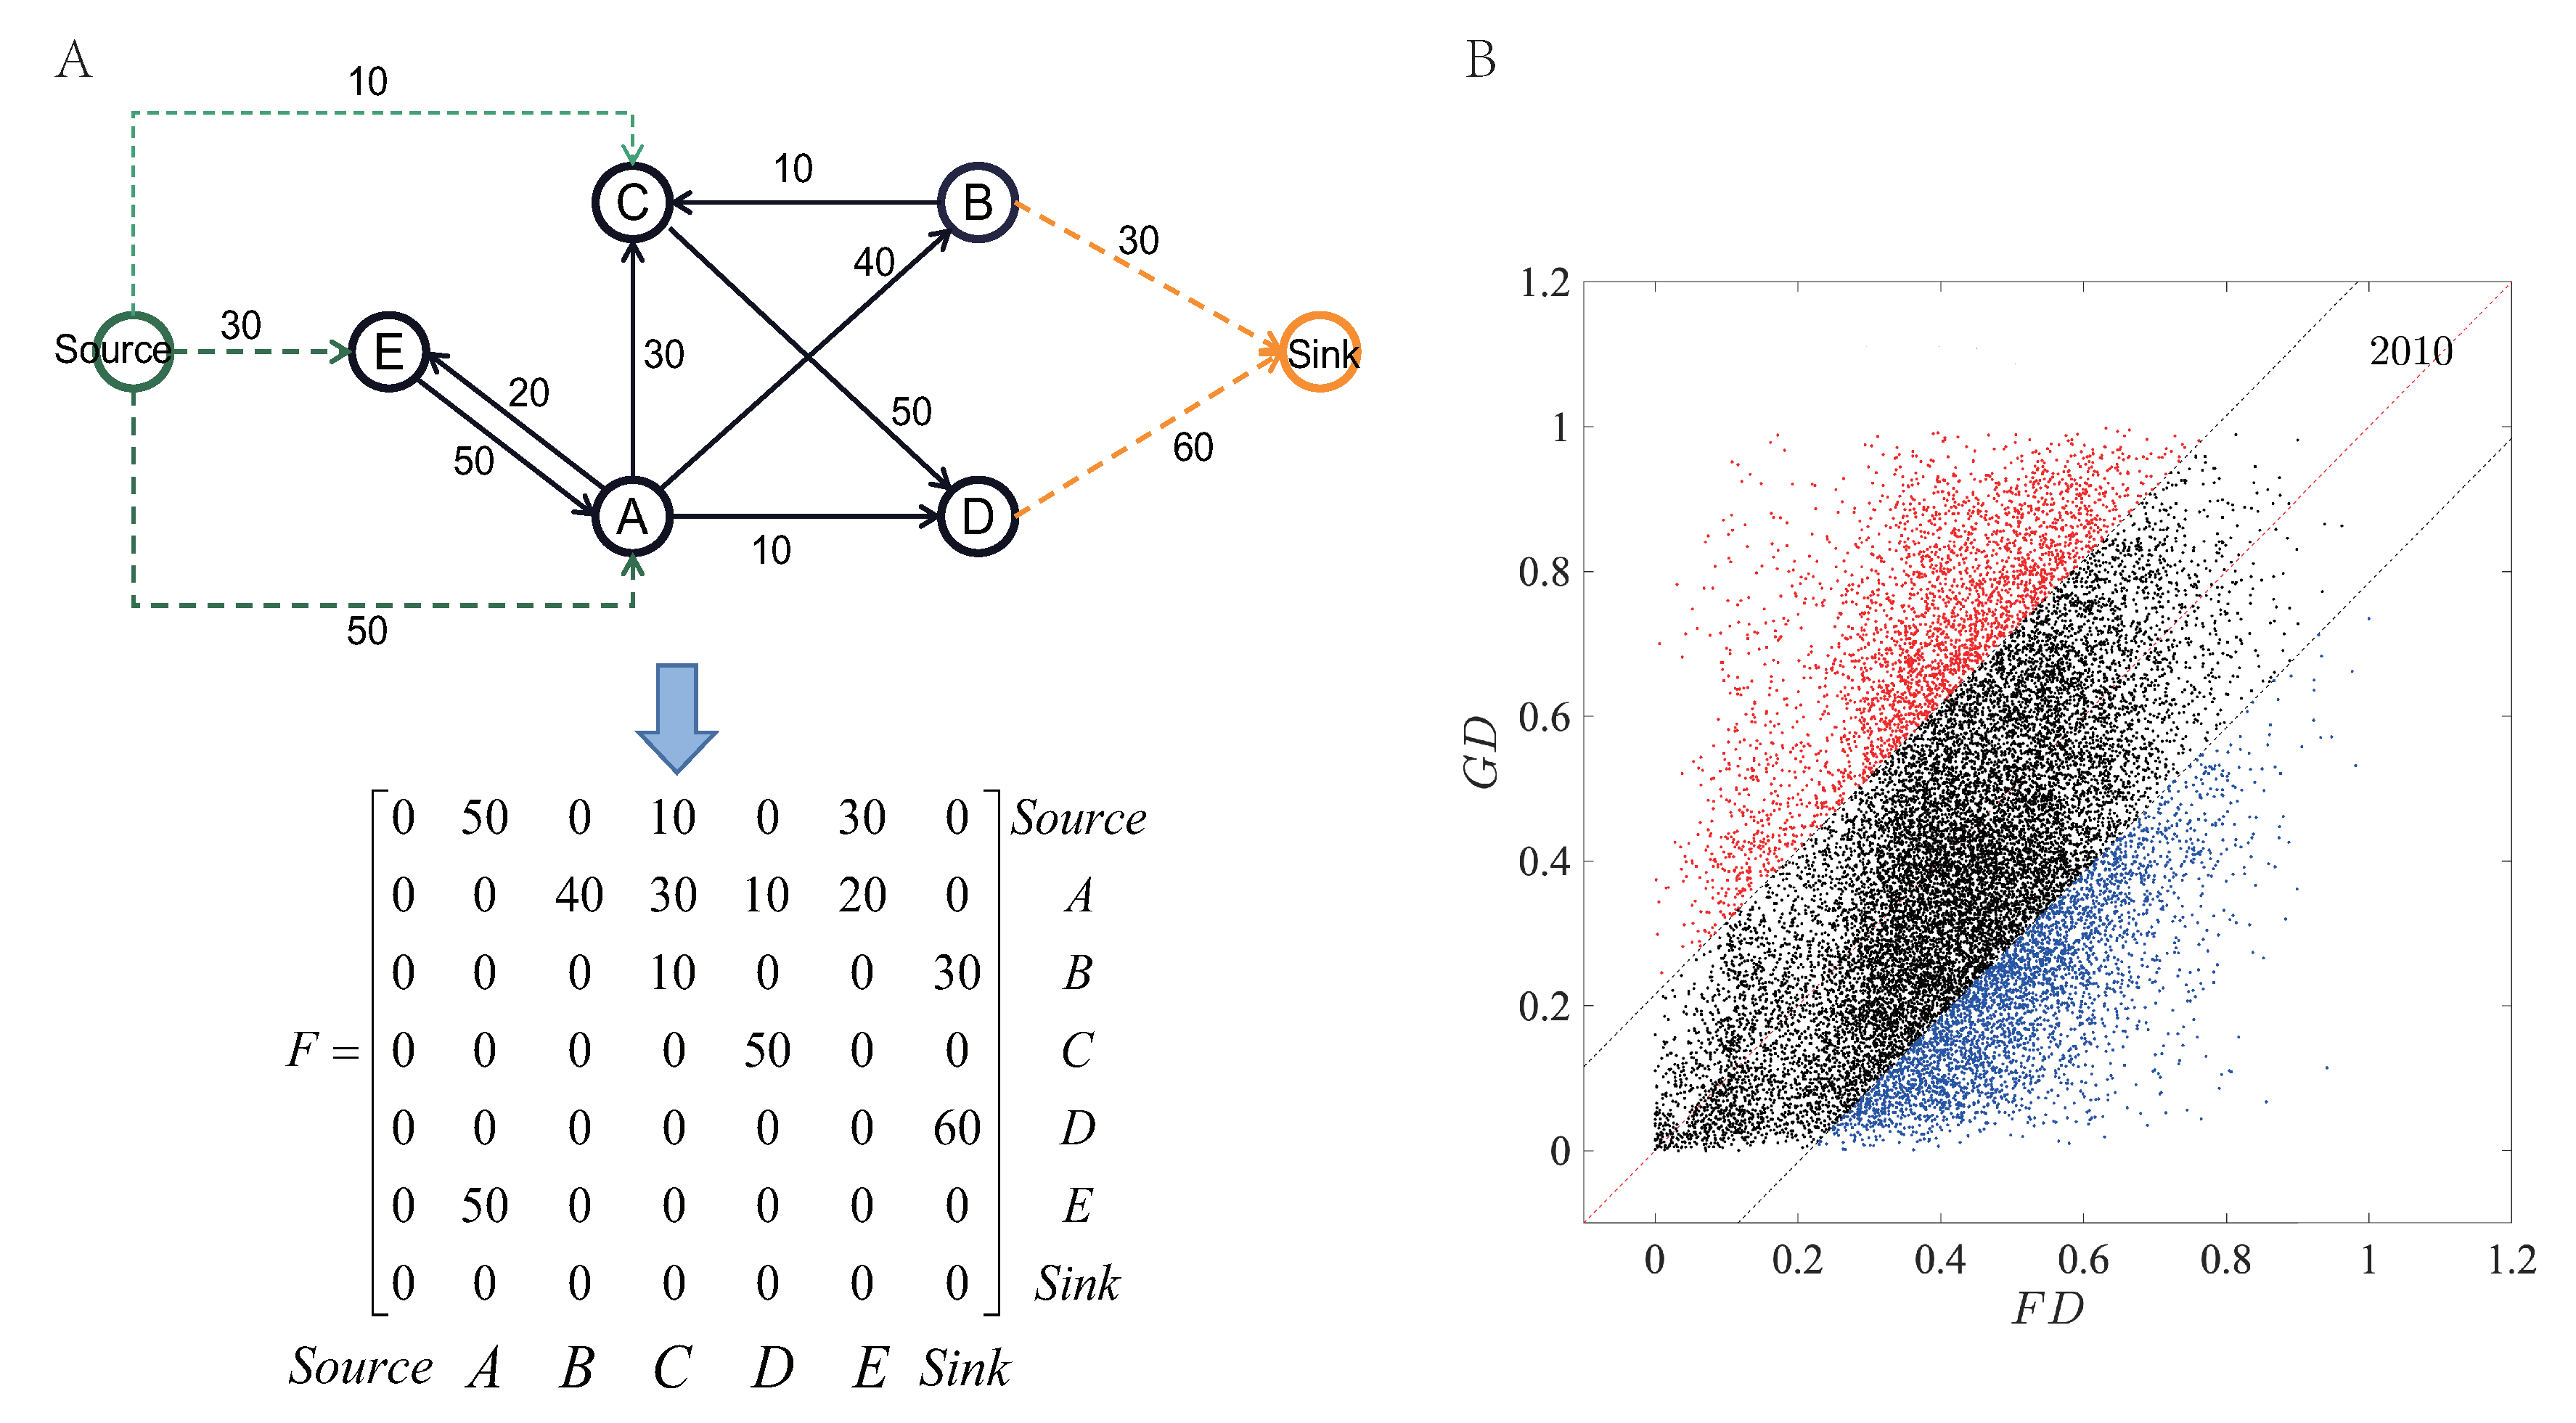
Figure 1. Flow complex network of energy trade. (A) International trade flows network diagram. Black solid lines denote the raw trade data, and dashed lines represent the trade gap between imports and exports. The source node and sink node make the country’s import and export trade in the balanced state, which helps the definition of a Markov matrix during the derivation of flow distances. (B) The plane rectangular coordinate system consisting of flow distance (FD) and geographic distance (GD). y=x is the case where the flow distance is equal to the geographic distance. The black area in the picture is the range of standard deviation ±σ of a straight line y=x . Blue and red represent the data points beyond the standard deviation range.

Figure 3. Correlation analysis of flow distances and geographic distances: (A) the correlation coefficient evolution of flow and geographical distance in all products; and (B) the correlation coefficient evolution of flow and geographical distance in more detailed energy products.