关键词:电力消耗、夜光数据、节能减排
提供者姓名:Jiandong Chen等
提供者邮箱:minggao1994@163.com, liuyu@casipm.ac.cn
提供者单位:东南大学财经学院
数据简介:Global 1 km × 1 km gridded revised real gross domestic product and electricity consumption during 1992–2019 based on calibrated nighttime light data。格式为tif、ovr,可用Arcgis读取。数据坐标系:WGS1984坐标。数据单位:千瓦时。
数据来源:Scientific Data
数据年份:1992-2019年
数据格式:tif、ovr
数据大小:14.2G
读取软件:Arcgis
使用说明:院内院外公开使用
是否提供小样本sample:不提供
下载链接:查看
X
数据使用声明
为尊重知识产权、保障数据作者和数据服务提供者的权益,请数据使用者认真阅读数据提供方的使用规范:Chen, Jiandong; Gao, Ming (2021): Global 1 km × 1 km gridded revised real gross domestic product and electricity consumption during 1992-2019 based on calibrated nighttime light data. figshare. Dataset. https://doi.org/10.6084/m9.figshare.17004523.v1。在基于本数据所产生的研究成果(包括项目评估报告、验收报告,以及学术论文或毕业论文等)中标注数据来源,并按照[文献引用方式]标注需引用的参考文献,同时将可公开成果提交到"北京师范大学系统科学学院大数据中心邮箱:sssdata.bnu.edu.cn"。
数据来源引用参考以下规范:
中文表达方式:Chen, Jiandong; Gao, Ming (2021): Global 1 km × 1 km gridded revised real gross domestic product and electricity consumption during 1992-2019 based on calibrated nighttime light data. figshare. Dataset. https://doi.org/10.6084/m9.figshare.17004523.v1;英文表达方式:Chen, Jiandong; Gao, Ming (2021): Global 1 km × 1 km gridded revised real gross domestic product and electricity consumption during 1992-2019 based on calibrated nighttime light data. figshare. Dataset. https://doi.org/10.6084/m9.figshare.17004523.v1。
致谢方式参考以下规范:
中文致谢方式:"感谢北京师范大学系统科学学院 (https://sssdata.bnu.edu.cn)提供数据支撑。"
英文致谢方式:" Acknowledgement for the data support from School of Systems Science, Beijing Normal University (https://sssdata.bnu.edu.cn)."
*本数据的使用者必须遵守数据提供方的使用要求和使用规范,依照《中华人民共和国数据安全法》的要求存储和使用相关数据。
*未经数据提供者的书面许可,任何单位及个人不得以任何方式或理由对上述数据产品、服务、信息、材料的任何部分进行复制、修改、抄录、传播及销售。
*凡侵犯本平台版权等知识产权的,本平台必依法追究其法律责任,特此郑重声明!
是否同意上述要求?
简要说明:
该数据的核算方法来自:Chen, J., Gao, M., Cheng, S. et al. Global 1 km × 1 km gridded revised real gross domestic product and electricity consumption during 1992–2019 based on calibrated nighttime light data. Sci Data 9, 202 (2022). https://doi.org/10.1038/s41597-022-01322-5
下载地址为:figshare. Dataset. https://doi.org/10.6084/m9.figshare.17004523.v1
采用了134个国家的GDP数据,夜光数据来自:Defense Meteorological Satellite Program/Operational Linescan System (DMSP/OLS) and National Polar-Orbiting Partnership s Visible Infrared Imaging Radiometer Suite (NPP/VIIRS) images,估算了全球1km乘以1km分辨率的电力消耗数据。ovr文件可以用Arcgis软件打开,在匹配不同空间尺度行政区域的前提下,能够得到各国家、城市、区县级别的电力消耗估算值。具体方法如下:As for electricity consumption, the gridded growth rate of nighttime light data was used to estimate the growth rate of gridded electricity consumption. However, because the growth rate of electricity consumption was mainly driven by the industrial sectors rather than the residential sector, the growth rate of the nighttime light data may not comprehensively capture the growth rate of electricity consumption. Thus, we combined the growth of official GDP and nighttime light data to better reveal the gridded growth rate of electricity consumption. Given that only the worldwide electricity consumption during 1992–2015 was open-access and available freely, we selected the gridded electricity consumption data in 2015 as the basic values. With regard to the basic values of gridded GDP in 2019 and electricity consumption in 2015, we first established the relationships between national nighttime light data (i.e., the sum of the DN values) and targeted variables (i.e., GDP and electricity consumption) based on the top-down approach, respectively. Thus, the ratios of GDP and electricity to the nighttime light data (i.e., the coefficients of the targeted variables per unit of DN value) can be estimated among different countries (or regions) during 1992–2019, and each 1 km × 1 km grid can be assigned GDP and electricity consumption with the DN value as the weight. Thus, the ratios of GDP or electricity consumption to DN values were estimated.
关于Arcgis的基本使用方法,请参考本中心举办的培训视频:http://gofile.me/6W4h7/kW3dJVBdH 。
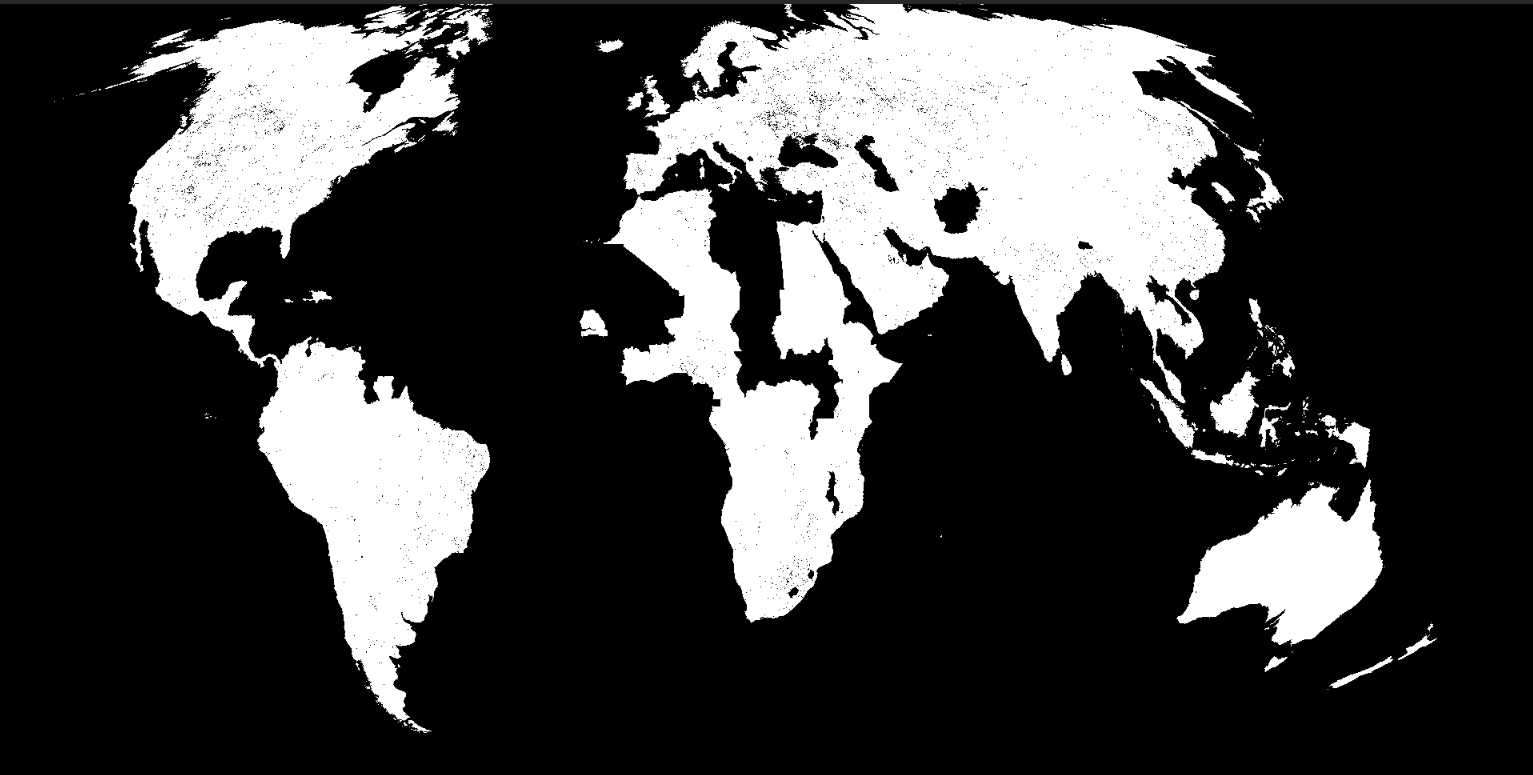
估算得到的2019年高分辨率的电力消耗数据